
After observing this bull market unfold for 18 months it appears to be repeating recent pattern with a few variations. The pattern, as we have discussed before, is similar to the 2002-2007 bull market. That bull market took 60 months to unfold, this one is moving a lot faster. My best estimate, at this stage of the wave structure, is for a top around the previous SPX 1576 high by February 2012. This is how I came up with this projection.
While the 956/954 waves are similar, the other two took half the time. The 1150/1163 took only 6 months instead of 12, and the 1220/1229 took only 3 months instead of 7. Using the time relationships already established in this bull market I was able to project a top around February 2012.
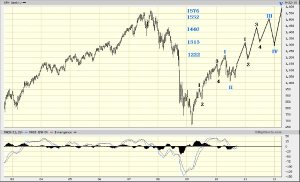
The OEW pivots during the 2002-2007 bull market were based on the 2000-2002 bear market. The pivots we are using now are a combination of the 2000-2002 bear, the 2002-2007 bull, and the 2007-2009 bear markets. Also, this bull market is following the same price track as the previous one, but it is terminating its waves one pivot below the 2002-2007 bull market. Tricky, but it is clear. Therefore I have some projections in price and time for the rest of the bull market.
1313 Jan 2011 1187 Feb 2011 (9% correction)
1440 May 2011 1313 Jun 2011 (9% correction)
1552 Sept 2011 1291 Dec 2011 (17% correction)
1576 Feb 2012 end of bull market
1440 May 2011 1313 Jun 2011 (9% correction)
1552 Sept 2011 1291 Dec 2011 (17% correction)
1576 Feb 2012 end of bull market

Pingback: SPX bull mkt projection update | the ELLIOTT WAVE lives on
Pingback: weekend update | the ELLIOTT WAVE lives on
Pingback: weekend update | the ELLIOTT WAVE lives on
Pingback: wednesday update | the ELLIOTT WAVE lives on
Pingback: weekend update | the ELLIOTT WAVE lives on
Pingback: friday update | the ELLIOTT WAVE lives on
Pingback: weekend update | the ELLIOTT WAVE lives on